For the return of volatility I fixed my VIX futures historical term structure dashboard: this is still available at https://virtualizedfrog.wordpress.com/historical-vix-term-structure/
Tag: vix
VIX Historical Term Structure
Trading volatility is particularly interesting these days: it is back and easy to buy using ETFs such as VXX or TVIX.
But these instruments are not following the VIX index directly.
I have found it useful to look at the VIX term structure available on the CBOE website.
But the historical VIX term structure has proven to be even more helpful to me in finding entry points.
I am now sharing on my Historical VIX Term Structure page the charts I am generating with a Python script and watching everyday.

The blue line is the rolling front month future, the green line the rolling second month future etc… You can clearly see the contangos and backwardations.
Let me know if you have any improvement you would like to see.
BASI Index – Bond Markets Liquidity
While researching venues and third party systems supported in the fixed income trading world, I took a deeper look at the MarketAxess website the this week.
While browsing through the documentation, I ended up on their research page where they demo their new index, the BASI.
This index measures the liquidity of the fixed income market in the US and in Europe (they have two versions of it) based on the bid-ask spread.

Looking at that chart, the correlation with the VIX index is striking. I tend to think it has been back-fitted at little but the interesting part is that it is starting to move upwards again.
Are investors starting to slowly move out of stocks to start buying more bonds? Is 2015 going to be a new volatile year?
Anyways, this is an interesting index I will keep my eyes on in the future, and I thought was worth sharing.
Parabolic SAR implementation in Python
I have recently tried to use the Parabolic Stop and Reverse indicator to track the VIX index (volatility on the S&P 500). A while back, I had used TA-lib and many of its indicators, but it was a while back. And I found it fairly painful to setup for Python this time. Given that I only needed this indicator, and that it is often better to have your own code for this kind of analysis, I simply translated an implementation from AmiBroker to Python. And here is a quick overview of what it looks like: 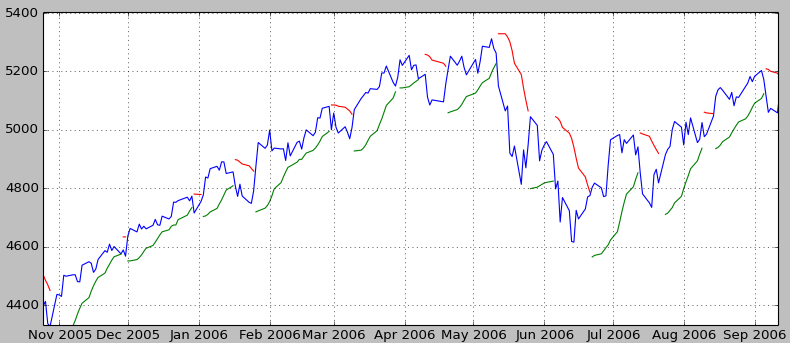 The full code can be downloaded from my GitHub account.
def psar(barsdata, iaf = 0.02, maxaf = 0.2):
    length = len(barsdata)
    dates = list(barsdata['Date'])
    high = list(barsdata['High'])
    low = list(barsdata['Low'])
    close = list(barsdata['Close'])
    psar = close[0:len(close)]
    psarbull = [None] * length
    psarbear = [None] * length
    bull = True
    af = iaf
    ep = low[0]
    hp = high[0]
    lp = low[0]
    for i in range(2,length):
        if bull:
            psar[i] = psar[i - 1] + af * (hp - psar[i - 1])
        else:
            psar[i] = psar[i - 1] + af * (lp - psar[i - 1])
        reverse = False
        if bull:
            if low[i] < psar[i]:
                bull = False
                reverse = True
                psar[i] = hp
                lp = low[i]
                af = iaf
        else:
            if high[i] > psar[i]:
                bull = True
                reverse = True
                psar[i] = lp
                hp = high[i]
                af = iaf
        if not reverse:
            if bull:
                if high[i] > hp:
                    hp = high[i]
                    af = min(af + iaf, maxaf)
                if low[i - 1] < psar[i]:
                    psar[i] = low[i - 1]
                if low[i - 2] < psar[i]:
                    psar[i] = low[i - 2]
            else:
                if low[i] < lp:
                    lp = low[i]
                    af = min(af + iaf, maxaf)
                if high[i - 1] > psar[i]:
                    psar[i] = high[i - 1]
                if high[i - 2] > psar[i]:
                    psar[i] = high[i - 2]
        if bull:
            psarbull[i] = psar[i]
        else:
            psarbear[i] = psar[i]
    return {"dates":dates, "high":high, "low":low, "close":close, "psar":psar, "psarbear":psarbear, "psarbull":psarbull}
